Gif infographics: what are they, how to make them and what are their uses
If you surf the web regularly you will have come across some kind of infography. Whether they are static or dynamic, they are everywhere. Infographics are one of the strongest visual tools for the content marketing strategy of brands.
Online marketing is quick, efficient and always seeks to progress and surprise. We internet users are demanding, and very, very curious. Consequently, our demands have been heard, and technology has made possible a new phenomenon in content marketing: GIF infographics or gifographies.
They do not have a wide presence in Spain yet, rather belonging to the unknown, but we are sure that in a few months they will be everywhere. Do not let anybody take advantage!
What are they?
A gifography is the combination between a traditional infographics and an animated GIF. Hence the original name…
Infographics remind a little of dynamic infographics: there is motion too, but the format is that of a static infographic, with a single image. In other words, a gifography is content that illustrates information about a topic using GIFs and pictures in motion.
We will now show you the difference between a dynamic infographics and a gifography:
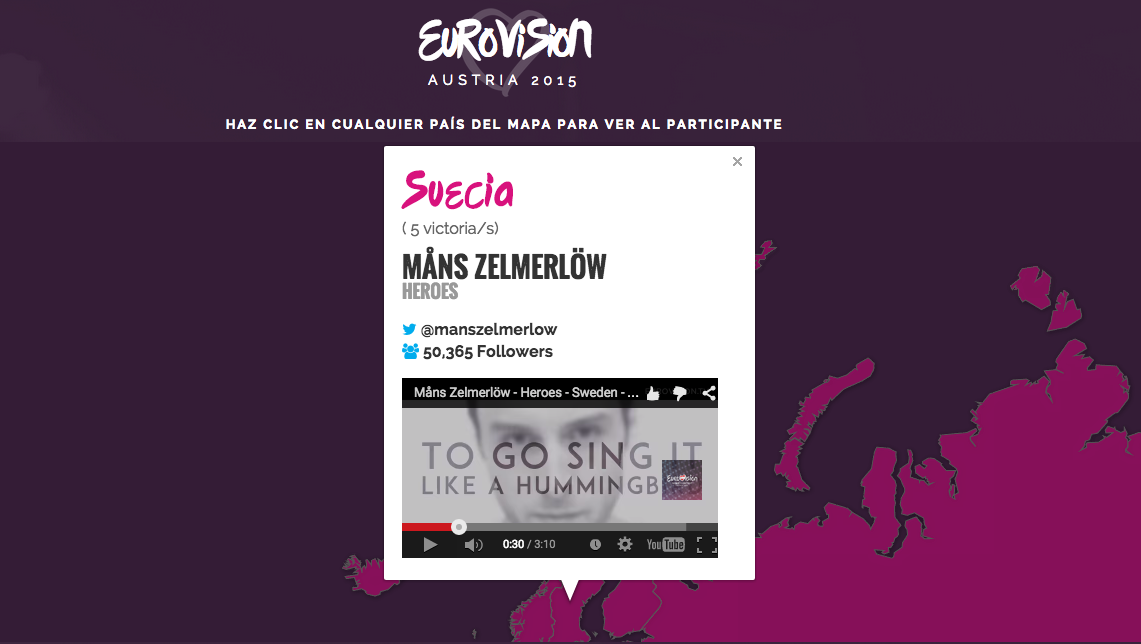
This dynamic infographics, made by Internet República, shows curious facts about the participants of Eurovision 2015: its impact on social networks, tweets and hashtags, in a funny and interactive way.
And this is a gifography made by illustrator Jeca Martinez in 2012.
Gifographies can cover any topic, and their purpose is to tell a “story.” It starts on the upper part of the picture and it ends at the bottom. The idea is that the full picture tells a story in order, where one item leads to the next until the end, as if we guided the reader through it.
What are their benefits?
These are the main advantages of gifographies:
- They save time by shortening long and boring explanatory texts.
- They turn statistics, graphs and numeric data into something funny.
- It is a nice method to explain and instruct the reader about a complex topic or thought.
- The tool has a great potential to get the attention and generate a strong brand image.
- The content has great viral potential.
- It is unique and memorable.
Some other advantages we can think of…
- They convey a friendly, sympathetic and positive feeling on the reader.
- You can play with visual features such as colours, shapes and designs.
- They use storytelling, a key tool in marketing.
- It stimulates engagement, communication and conversations between the reader and the brand.
- You can quickly find the information, helping to identify what you want readers to read.
- It positions the brand as dynamic and adaptable to new trends and new technologies.
What are the differences?
Now that the visual difference between a dynamic infographics and a gifography is clear, many of you will ask yourselves what are the differences in terms of usage, advantages and disadvantages. So why not show it using one? SEO Expert Page is exactly what we were looking for:
How to create one
You can make them directly on Adobe Photoshop. It is quite simple, although it requires some work and time. Follow these steps:
- Plan a graphic script to illustrate the topic in sequences and a preset order. This will make it easier to read and understand.
- Use the infographics format as a draft, like a preliminary version. With this you will be able to identify the sections where the GIFs will be included, indicating where will there be motion and where will it remain static. Infographics will also help decide about the structure and design of the gifography.
- Get the files and store them in individual folders: The GIFs and images you want to use. You can use existing GIFs or create your own. Make sure that the files are saved with the correct format.
- Work on Photoshop, editing, cutting and rotating the images.
- Load the images from “File > Scripts > Load files into stack.” Do not forget to check the layers’ panel and the animation window. Next, show the animation frames. You will see that only one is shown, but you can change this from “Pallete Options > Make Frames from Layers.” If the images are not in order, click on “Palette Options > Reverse Layers” to change this.
- Choose the animation speed: normally between 1 and 1,5 secs. Try the result and make sure that it is the one you set. Select the option to adjust the loop “always” so that it is constantly moving.
- Save the gifography on the proper format. View it on different devices to confirm that it opens correctly. You can compress the size to speed it the loading time.
- Share it in as many media as you can: social networks, blogs…; and make it go viral.
Stories of success
SEO Expert Page chose this gifography to show how to use Tumblr for SEO and Social Media:
On the other hand, Animagraffs used the same method to simplify the (very complex) car mechanics. It reached 350,000 visits in less than 30 days. Impressive, is it not?
Or this last one, by The Major Design, that employed a smart design to illustrate the demographic data about the value of contemporary art by country.


Internet República
Latest posts by Internet República (see all)
- New Instagram update: reel achievements - 19 October, 2023
- Elon Musk has bought Twitter. What does this mean? - 27 April, 2022
- NFTs ARE ARRIVING ON SOCIAL MEDIA - 21 February, 2022