Excel to analyse seasonal keywords
Today we bring you an Excel to do an analysis of seasonal keywords using the Keyword Planner tool by Google AdWords.
You can download it here: detectar_estacionalidad_v1
As you already know, we can either get the volume of searches of ideas for keywords related to a set of keywords we give in the beginning or the volume of searches of a closed group.
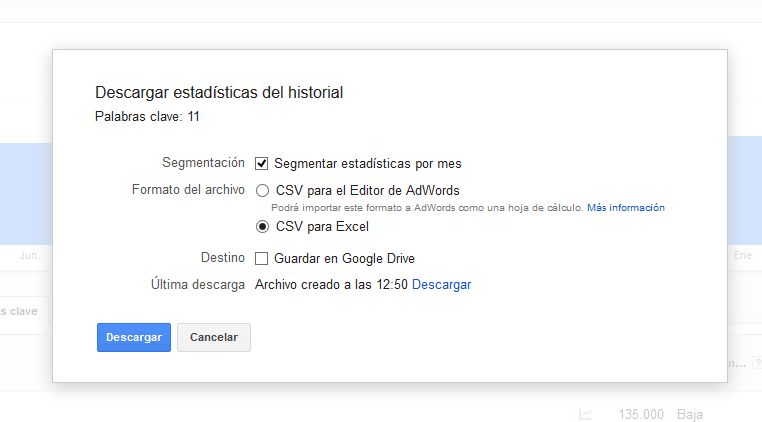
Be it as it may, we have to download the file indicating that it has to be segmented by months.
These are the words we are going to analyse (in Spanish):
– music, books, perfumes, holidays, toys, beaches, New Year’s Eve, football league, buy car, Christmas basket
Since this is an example, we have used some which are clearly seasonal and others that we suppose have more homogeneous search patterns throughout the year.
On the Excel tab “Adwords” we paste the data directly from the CSV. This tab contains all the data in case we need it at some point. The columns with an orangish background have the content that will be used on the next tab.

Under the tab “Monthly” we have to paste (in the same order) the data of the Adwords tab marked in orange. These data are the keyword and the 12 months in a year. They appear marked with a grey background under the tab “Monthly.”
We have to be careful to write the name of the months correctly on the heading, because the data start on the month when the query is made, which in the case of this Excel corresponds to April.
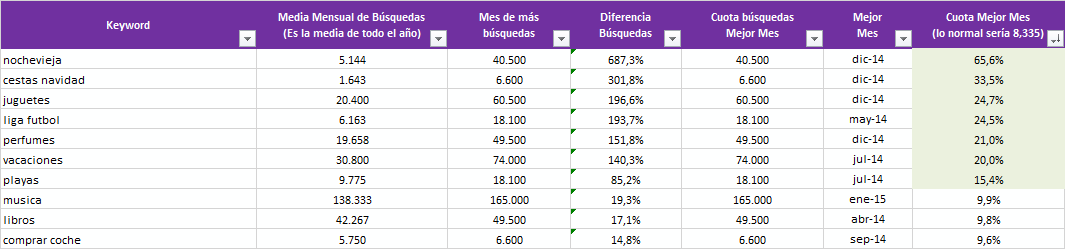
The cells marked in green are automatic calculations that detect the seasonal nature. With this we can extract seasonal words-at different levels-without seeing it graphically. These cells help us see what month is best-if there are more than one, choose the first-and their rate.
A word that is searched homogeneously all the year through would have a rate of 1/12, i.e. 8.33%. The further the rate of the best month is from this figure, the higher the seasonal variation of the month.
For example, the best month for “comprar coche” (“buy a car” in Spanish) has 9.6%, whereas “nochevieja” (“New Year’s eve” in Spanish) has a rate of 65.6% in the best month, which in our example is of course December, 2014.
The tab “Datos_Grafico” (Data of the graph) is simply operative and it is for extracting graphs on the next tab. It is a very simple way to do dynamic graphs. We have to be careful that the order of the headings in the months is the same as in the two previous tabs.
In this tab we only have to update the headings if we do a new analysis with other words after some months.
The tab “Resumen” (Summary) is based on the monthly data, and it is a summary where the monthly series have been eliminated for the sake of clarity.
Under this tab there is also some sort of dynamic graph, where if we choose a word from the list of words that have been analysed, it represents graphically the monthly searches, so that we can see the seasonal nature more intuitively, or we can use it for reports by word.

This is the summary of our keywords analysis. We have marked on green the keywords that are clearly seasonal.
If you need to adapt the spreadsheet to your own analysis, you have to update the ranges of the formulas so that they cover all the arrows and columns of your list of words. The range of the formulas on Excel where you can use “vlookup()” is normally set to $999 or $9999 so that you do not have to change it all the time and so that it covers a reasonable amount of words.
Link to download the Excel spreadsheet: detectar_estacionalidad_v1


Internet República
Latest posts by Internet República (see all)
- New Instagram update: reel achievements - 19 October, 2023
- Elon Musk has bought Twitter. What does this mean? - 27 April, 2022
- NFTs ARE ARRIVING ON SOCIAL MEDIA - 21 February, 2022